
[This is to claim the ownership of this article due to non-payment from the client. Please do not reprint this article in any sites without permission.]
PLA has a storage coefficient value E' similar to that of a glassy compound. The value E' was 3GPa. At a temperature of 68 degree Celsius, the storage modulus began decreasing constantly with the glass transition of PLA. This temperature was noted to be the glass transition temperature Tg. The storage coefficient E' went right below 300 MPa at this temperature reducing to more than 1 order of magnitude. With further increase in temperature, the storage modulus increased at 120 degree Celsius when the cold crystallization of PLA was initiated. The storage modulus of clean PHBV was at the highest level when the temperature was below its glass transition temperature, Tg. As the temperature progressively went above the Tg value, the storage modulus E' dropped consistently with the change of PHBV to glass state. When the value of storage modulus E' at room temperatures was compared between PLA and PHBV, the value for PLA was higher than that of PHBV. Taking ternary blends into consideration, the storage coefficient value at above room temperature condition was higher with blends of high PLA content which was raised with the quantity of PLA. Comparatively, at temperatures below the Tg value of PHBV, the blends with a higher PHBV content displayed higher modulus value. The experiment also has an interesting factor that the temperature at which cold crystallization was initiated in PLA was lowered significantly with the addition of PHBV and PBS. The E' value also increased at a lower temperature consequently, with the cold crystallization. This directly proved that the cold crystallization property of PLA can be enhanced with the addition of PHBV and PBS supporting the results of DSC.
When the loss modulus (E”) and the storage modulus (E') is compared to form a proportion, we get the Tan delta(tan δ) value. With the increase of temperature, the tan δ value was found to peak at a certain point where the E' storage modulus value was found to drop at a higher rate than the loss modulus E”. This tan δ value at the peak point represents the Tg where there is a change in molecular stability. While creating a polymer blend, the glass transition temperature plays a crucial role in determining the ability of the components to form a homogeneous mixture. The miscibility of the different polymer blends were determined with DMA analysis and was represented in terms of the tan δ value. In the graphical representation, the tan δ value peaked at 68°C at the PLA glass transition temperature for clean PLA test. With blends of higher PHBV and PBS content, the peak was found to have moved a little lower towards the lower temperatures in the tan δ graph. The conclusion can be drawn from these studies that PLA has reduced miscibility with the other ternary blend components in minor phases. The concentration was varied through the studies, and it was found that with difference in concentration values, the Tg of PLA and PHBV shifted to each other. There was no such phenomena noticed with PBS. This proved that PLA and PHBV have a better miscibility when compared to PBS which pointed at a better interaction existent between the two.
Structural Form of the Ternary Blends
The mechanical traits of the ternary blends are influenced greatly by the phase structures. The physical properties and characteristics of the ternary blend is determined greatly by the types of divisions and the characteristics of the phases. By analyzing the phase morphology, the relation between the microscopic structure and the properties displayed by the blend can be determined. The blends in the multiple phases are differentiated based on their morphology using scanning electron microscope and transmission electron microscope. These instrumental methodologies were used to study the phase morphology of the blends in detail. The micrographs thus created, displayed the magnified images of the crystalline fracture sections of the ternary blends. It was clearly found in the images that the PBS and PHBV particles were dispersed as particles along with the dark holes created on fractions, with the PLA acting like a matrix. PLA was spread out acting like the matrix with slight indistinct surface and the PBS and PHBV phase molecules were spread on the matrix of the ternary blend like spherical structures. The molecules were of the dimension of submicrometer in the blends. They were having a smooth surface with distinct borders and directed at the weak adhesion and compatibility of the phases. The behavioral style was different with ternary blends in which PHBV was the matrix. For blends of the ration 60/30/10 of PHBV/PLA/PBS concentration, it was found that the phase morphology was of the core-shell kind. PLA formed the shell and PBS formed the core in such a structure. Changing the concentration of PLA and PBS caused further changes in the phase morphology and thus produced different phase structure.
While checking the TEM micrograph, it has to understood that all three components of the ternary blend are derived from the same aliphatic polyester classification and display similar chemical and physical properties. They have only a minor difference in density causing only slight scattering of the electrons and therefore cannot be easily recognized differentially through the TEM micrographs especially the minor phases. But it yet showed the same signals as the SEM result where blends with PLA as matrix had displayed phase morphology. Same as the Sem result, the minor phase diameter was in submicrometer. The minor phases could be determined through the diameter and composition. The larger granules in the PLA/PHBV/PBS blend in 60/30/10 ratio can be analyzed to be PHBV based on its concentration. The irregular structure can be due to the altering of the morphology of PBS while creating the fraction for microscopy. The PHBV/PLA/PBS blend in 60/10/30 had a uniform dispersion of phases as observed in SEM. But the organization was not evident in PHBV/PLA/PBS blend of 60/30/10 which was found to have a core-shell organization structure in SEM. This is because of the minor density difference between the three components. Understanding the morphology of the ternary blend components would be difficult without proper staining and is a great challenge due to the weak difference exhibited.
In accordance to previous researches conducted on polymer blends of different phases, it has been found that the morphology of the mixture can be determined by studying the interfacial interaction between the different constituents that make up the blend. Hobbs et al. had made changes to the equation put down by Harkin's through his study over multiphase blends. He used the ideal of dispersion coefficient by which the component phases were spread out in a matrix phase and this was used to study the ternary blend morphology. Considering a ternary blend with three components, namely 1, 2 and 3, in which 2 is the matrix phase, the spreading coefficient is denoted by λ31 where
λ31 = γ12-γ32-γ13
In the equation, λ31 is spreading modulus of phase 1 over phase 3 and γ12 is the tension between the two components. For component 1 to be encapsulated by 3, it is required that λ31 value is positive. As per the equation, if λ31 and λ13 are both negative, then the components are immiscible and form separate phases. The equation sets a relationship between the phase morphology and interfacial tension between the components. The value of the interfacial tension is evaluated using the harmonic mean formula at the optimal mixing temperature of 180°C.
1 2
|
1 2
| |||||||
γ dγd
|
γ Pγ P
| |||||||
γ12
|
= γ1 + γ2
|
− 4
|
+
| |||||
d
|
d
|
P
|
P
| |||||
γ1
|
+ γ2
|
γ1
|
+ γ2
|
25°C is maintained as the experimental value and the surface parameter values of PLA, PHBV and PBS were calculated by extending from this value to 180°C with the common temperature coefficient value of -0.06mJm-2K-1. Based on this equation, the surface tension for the individual polymers have been evaluated and listed in the scientific literature for PHBV, PLA and PBS for reference purposes.
Table 1: Values of surface tension for the ternary blend polymers at 180°C
polymer
|
γs (mN/m)
|
γd (mN/m)
|
γp (mN/m)
|
PHBV
|
32.6
|
31.7
|
0.9
|
PLA
|
34
|
30
|
4
|
PBS
|
46.4
|
32.4
|
14
|
Based on the values of surface tension thus calculated, the spreading modulus was determined.
Table 2: Spreading Coefficient calculated from the surface tension values at mixing temperature
sample (wt/wt/wt)
|
λ31 (mN/m)
|
PLA/PHBV/PBS(60/30/10)
|
−8.0
|
PLA/PHBV/PBS (60/10/30)
|
−13.1
|
PHBV/PLA/PBS (60/30/10)
|
3.83
|
PHBV/PLA/PBS(60/10/30)
|
−15.2
|
When PHBV/PLA/PBS ternary blend in concentration of 60/30/10 is considered, where PHBV acts as the matrix component 2, PLA as the shell component 3 and PBS as component 1 acting as core, the value λ31 can be evaluated to be 3.83 mN/m based on the above determined values. This positive value points to the fact that PBS is encapsulated inside PLA in this ternary blend composition. This directly approved the core-shell structure as observed in the TEM and SEM images. PLA displays a good interfacial adhesion reaction with PHBV matrix which will provide better stress transfer between the components of the blend. This is consequently increase the mechanical properties of the blend. Experiments and evaluations conducted on all other blend compositions gave a negative spread coefficient value which indicated that the phases remained separated in them.
3.5. PLA/PHBV/PBS blend characteristics based on thermal and crystallization
Basically, all 3 components of the ternary blend are the semi crystalline molecules. Its crystalline characteristics determine the physical, mechanical and temperature resistance properties of the individual polymers. The ability of crystallization of the polymers is also affected by several other minor components and these have to studies to know the exact properties.
A graphical representation of DSC cooling curve was created for the individual polymers and the blend. The cooling rate was 20°C/min after the components were melted at 190°C for a period of 3 minutes. PLA in its clean state did not display any exponential heat release at the crystallization on cooling. This showed that PLA acted like an amorphous polymer while cooling down after the melting at a rate of 20°C/min. But this was not the case with PHBV and PBS as the thermograms displayed exothermic peaks for both these polymers with the cooling rate of 20°C/min. The crystallization peak temperature was noticed to be 105°C and 72.3 °C for neat PHBV and neat PBS respectively. Then the neat polymer curves were compared to that of the blends. With PHBV, the crystallization temperature Tc shifted to lower temperature stating that the presence of PBS and PLA restricted the crystallization process in the polymer blend. This can be attributed to the finding that nucleation of PHBV was put down in the polymer blend by PBS and PLA. The heterogeneity moves from PHBV to PBS and PLA and thus the number of heterogeneous main nuclei decreases considerably due to this transformation. In recent times, studies on other PHBV blends have also reported similar changes based on the crystallization traits in blends of PHBV with PES, PCL and PBS. In blends with PLA as matrix, this decline n PHBV crystallization temperature can be attributed to the dilution caused due to the melting of PLA and PBS. This acts like a barrier for the attachment of the PHBV chains to the crystal formation chain. In contrast to the crystallization property of PHBV in the blend, the Tc value of PBS in the blend moved higher up when the graph between the clean PBS and blends was compared. This showed that PBS crystallization was promoted in the blend form. PHBV crystallized at an earlier stage than PBS and also the difference in their phasing is notable. PBS followed a phase differentiated crystallization technique whereas PHBV depicted sold crystallization phase. Speculations have also been made that there is possibility for PHBV to form dispersed crystal on cooling and then PBS crystallization takes place with these crystals as the nucleation sites. The improved property of PBS crystallization can be due to the availability of PHBV crystals as sites for nucleation.
Figure 10: Secondary heating DSC thermogram curve for the net polymer and blends after cooling at 20°C/min. (A) PBS; (B) PHBV;
- PLA; (D) PLA/PHBV/PBS (60/30/10); (E) PLA/PHBV/PBS (60/10/30); (F) PHBV/PLA/PBS (60/30/10); (G) PHBV/PLA/ PBS (60/10/30).

After the first heating thermal curve, the second heating was done for neat polymer and the blends. It was observed on this study that clean PLA polymer has a Tg value of 61.8°C and melting value of 169.8°C. The cold crystallization temperature can be observed as a peak at 101. 8°C. This value was compared to the cold crystallization of PLA in the blend and this value moved towards a lower temperature. The results thus evaluated with the second heating curve agreed with the DMA result that the cold crystallization characteristic of PLA was improved with the addition of PBS and PHBV in the blend form. The polymer blend underwent cold crystallization at a temperature above the Tg value as the polymer chains had enough mobility to form crystals. Based on the evaluations, the reason for the cold crystallization property of PLA on adding PBS and PHBV can be attributed to several reasons. The first reason can be due to the finding that PBS and PHBV do not show complete miscibility with PLA and the irregular state of the two polymer components could trigger the chain mobility of PLA. With the right amount of activation of chain mobility, the crystallization with increase from there on due to the chain structure of PLA. Another reason can be due to the fact that the PHBV and PBS surfaces act as nucleating centers and increase the crystallization. Studies on the enhancement of nucleation in a simple PLA/PCL blend was conducted by Yazawa et al. The system depicted limited compatibility and according to his studies he deduced that the phase interaction played a crucial role in the development of nucleation in blends. It suggested that the PCL domains that came together at the interface could bring a drop in the transition temperature thus promoting nucleation of the aggregated domains. This effect is very evident in polymer blends where phase separated domains came together to cause crystallization at the interface. In multiphase systems the polymer segment will be different with two aspects when compared to the chain of polymer at the interface. The first change is the breakage of the enrichment of chain. The interaction is initiated between the shorter chain and the third molecule in the interface and this will eventually increase the mobility of the chain structure of the polymer. Now, ordering of the polymeric coils take place at the interface of the blends. It has been proven in certain researches that the increased mobility of the segments at the free surface can initiate a local ordering of the chain at the near surface. This kind of local arrangement could act like a precursor to crystallization. Dollase and his co workers conducted studies on poly dimethylsiloxane directed to the fact that chains of intermediate length scale formations at non-random happening at the interface can help in the early stages of crystallization even if the proper ordering of the chain regions did not go along with the preset match for lower energy crystalline phasing. Such different regions may work by providing means for the system to go over the kinetic regulations that act as hindrance to crystallization. PET (polyethylene terephthalate) is a semi crystal polymer and studies conducted showed that the mobility was increased at the surface due to the aggregation lead to low cold crystallization temperature and increased the action at the free surface. Such previous results had shed reasonable light on the understanding of polymer activity in the interface in blends. As the PLA/PCL blend, the PLA/PHBV/PBS blend also displays compatibility thus supporting the reasoning that the presence of PHBV and PBS helps in nucleation of PLA. The melting temperature of PBS was not changed significantly in the neat stage and blend. The fusion peak in the thermogram for PHBV and PLA is placed at the same location making it difficult to differentiate between the temperatures. This bi-modal thermogram peak has been observed for both neat polymer and blend and may have been due to the melt-recrystallization technique of the polymer. This was viewed in DSC scans where the irregular crystals melted and reformed into crystals with perfection and then remelt at higher temperature.
It is essential to know the crystallization property of PLA to make it available for use and also in its production. PLA in its amorphous stage has a low glass transition temperature and slow crystallization rate which affects its processability and application. Therefore, to clear the effect of PHBV and PBS on PLA crystallization at melting state, after the crystal free melt, the samples were cooled at 2°C. Min with DSC technique and the cooling traces were recorded.
Figure 11: Cooling DSC thermogram curve cooled at 2 °C/min for neat polymer and the blends after crystal free melt: (A) PBS; (B) PHBV; (C) PLA; (D) PLA/PHBV/PBS (60/30/10); (E) PLA/PHBV/PBS (60/10/30); (F) PHBV/PLA/PBS (60/30/10);
(G) PHBV/PLA/PBS (60/10/30).
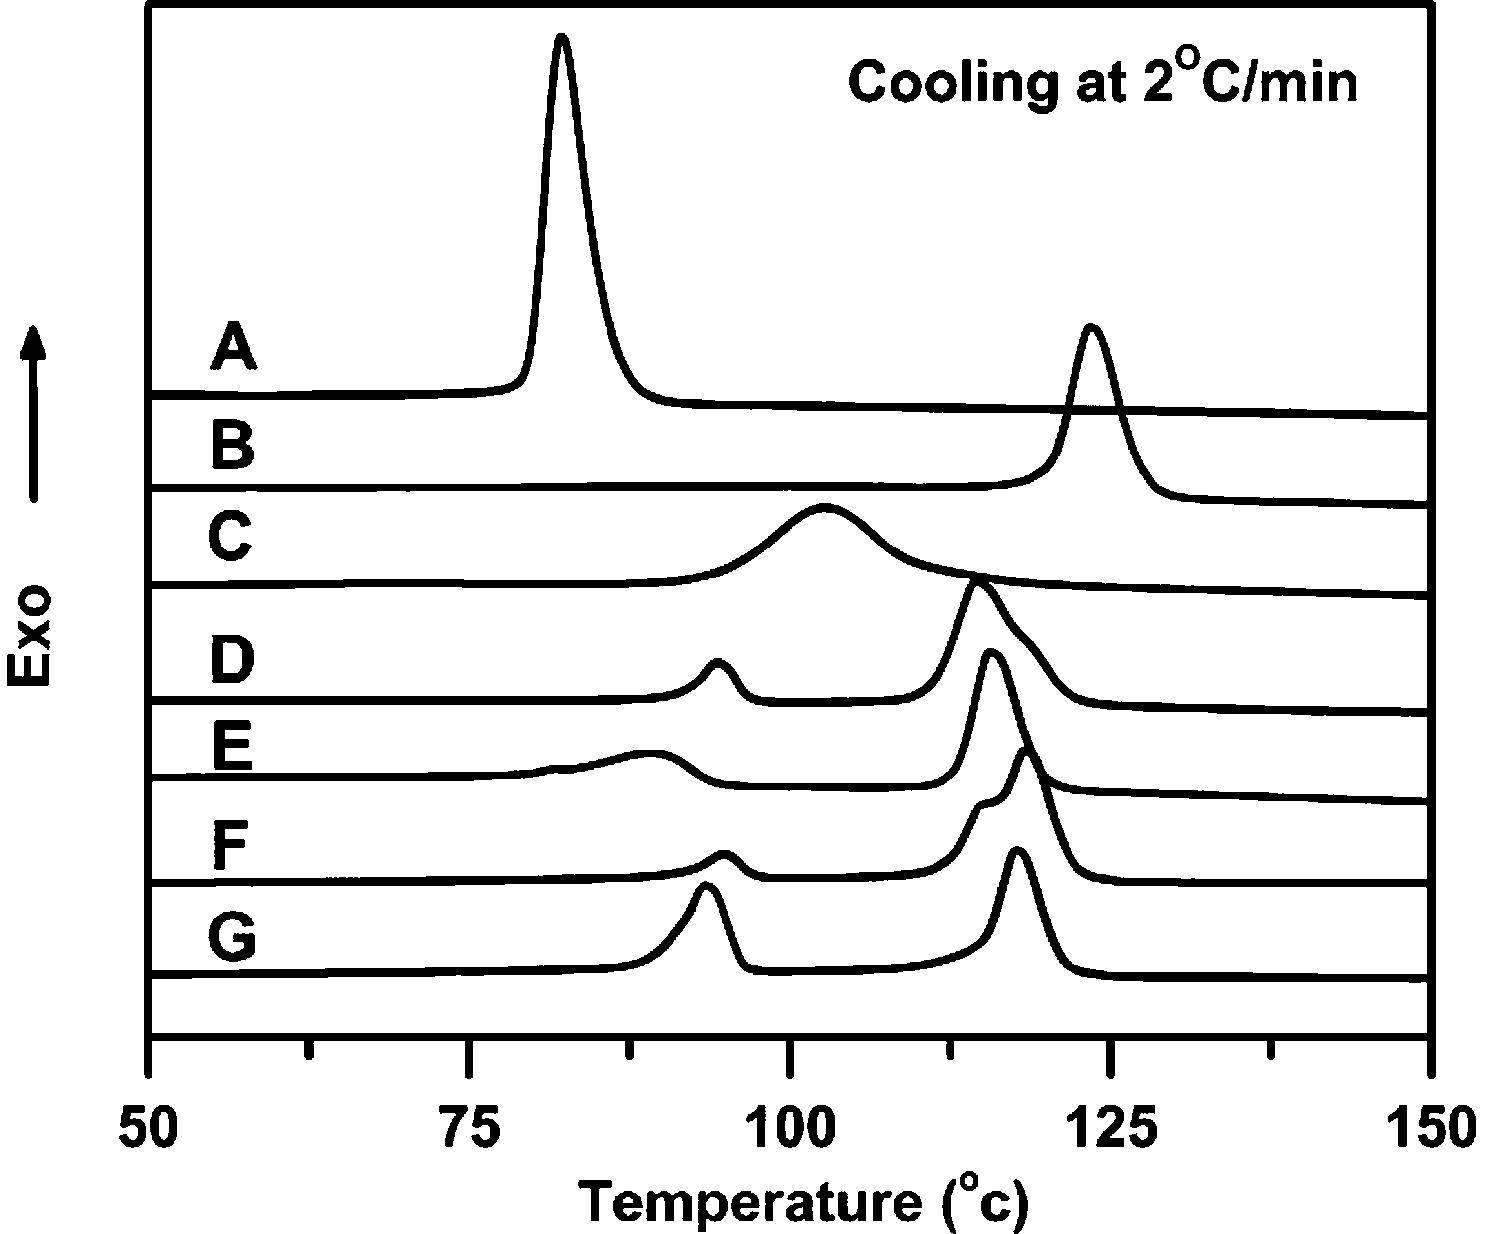
In case of neat PLA, the exothermic peak was formed at 98°C due to PLA crystallization. For blends with PHBV and PLA concentration of below 10%, the peaks coincided and thus the components could not be differentiated. The optimal blend PLA/PHBV/PBS of 60/30/10 could be thoroughly studied along with PHBV/PLA/PBS blend of 60/30/10. The thermograph shed light on all the exothermic peaks which were created based on the crystallization of the polymers that made the blend. With PLA, the Tc value moved to a higher temperature when compared to neat PLA showing that the crystallization of PLA was promoted in the blend form. The reason can be same as that of increase in Tc of PBS in the blend.
3.6 .Crystalline Blend Structure and X Ray Diffraction property
X ray diffraction technique is used to analyze the crystal structure of the blend and also the constituent polymers. In the production of the final polymer product, it would involved non isothermal processes like injection molding. Therefore it was necessary to understand the crystal structure formed in melt state under non isothermal condition. This has been represented in the below graph at 20 °C/ min cooling rate.
Figure 12: Wide Angle X-ray diffraction for melt crystallized polymers. (A) PLA; (B) PHBV; (C) PLA/PHBV/ PBS (60/30/10); (D) PLA/PHBV/PBS (60/10/30); (E) PHBV/ PLA/PBS (60/30/10); (F) PHBV/PLA/PBS (60/10/30); (G) PBS.
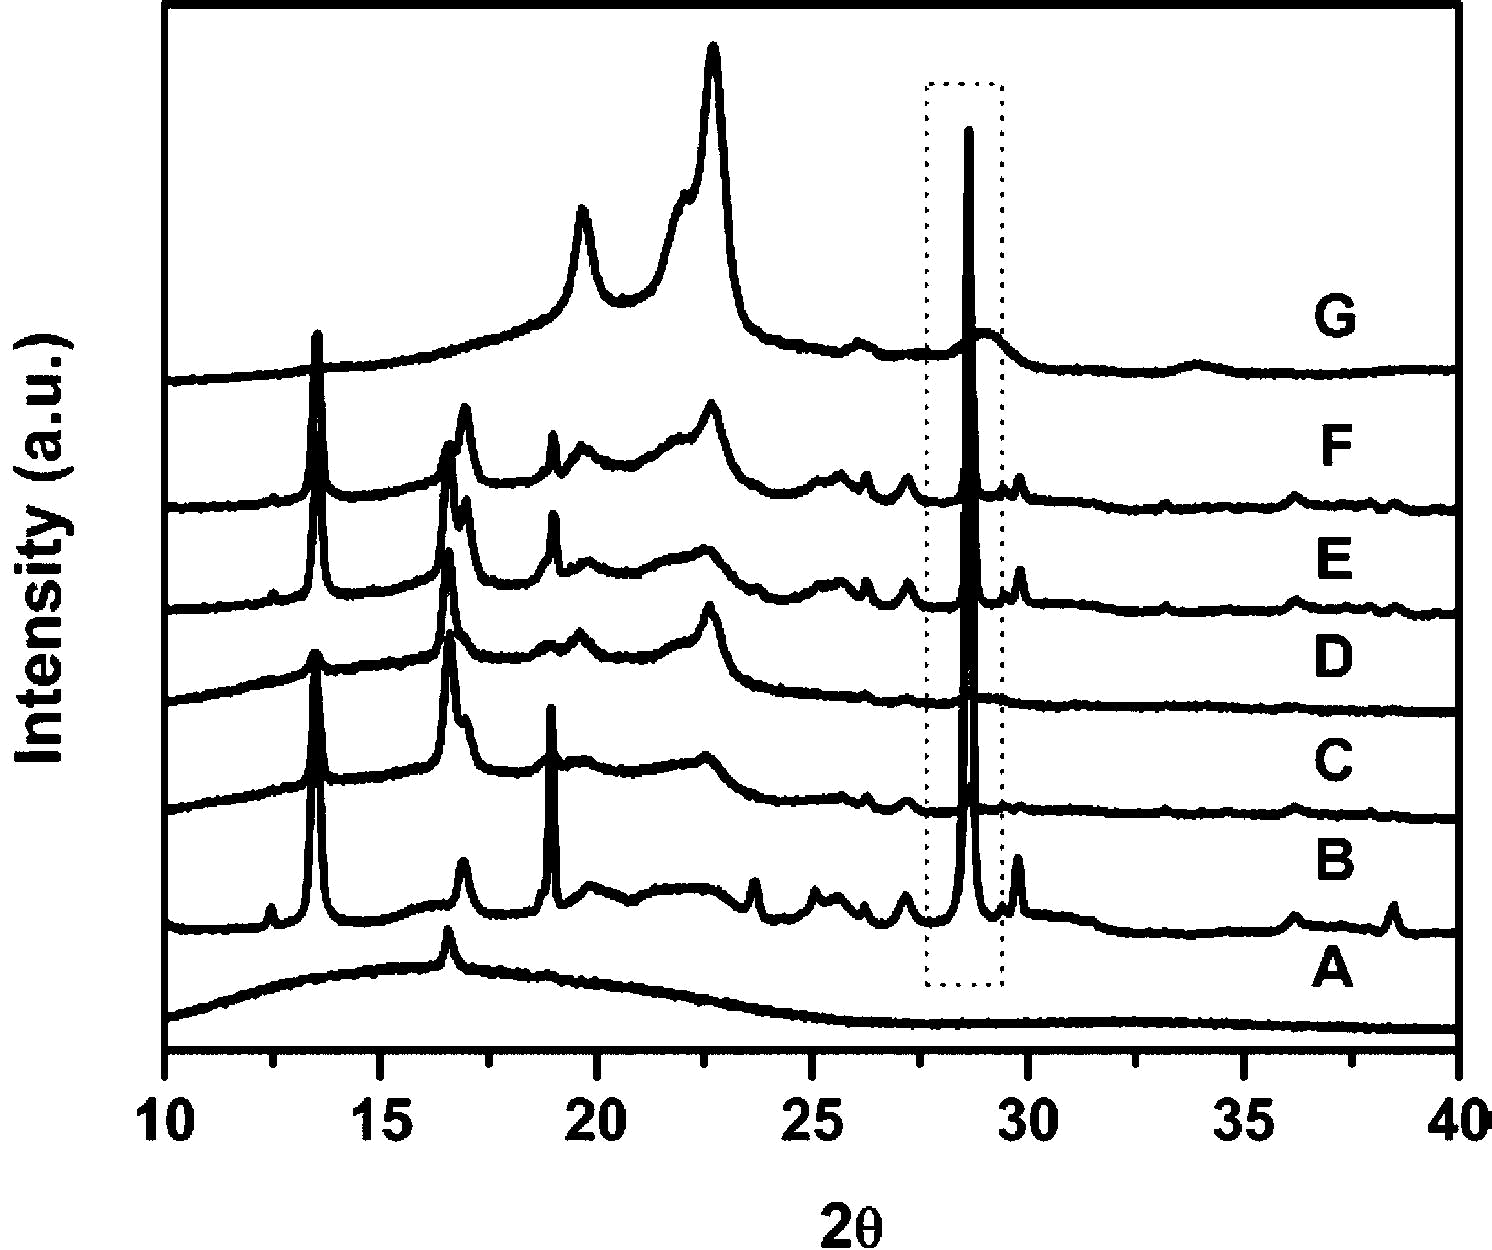
Looking at the curve for neat PLA, the single diffraction peak at 16.5 °C denotes the low quality crystal formation in nonisothermal conditions. PHBv in its neat state has two diffractions at 12.9 and 16.3 formed correspondingly at 020 and 220 planes in the unit cell structure. The graph shows the strong diffraction peak in dotted lines in a rectangle and this has led to the formation of the inorganic filler of the PHBV. PBS also has three strong diffraction peaks at 19.6, 21.9 and 22.7°C at the planes of 020, 010 and 110. In this graph for ternary blend, it was noticed that the diffraction peaks of the components were formed at the same position. There are no shifts in the peak formation and that directly implies that the three different components of the blend has crystallized differently within the blend. In the blends, with difference in concentration, the peak intensity had changed. Pla has a weak diffraction peak in its neat form and PLA in the blend form had a strong peak at 16.5°C at 200 and 100 plane figures in the box. This shows that the crystallization of PLA was increased in the blend which supports the previous DSC report.
3.7 Heat Deflection Temperature
This is the measure of the maximum working temperature limit of a plastic and is measured by applying temperature and measuring the value at which the material will change by 0.25mm with a pressure load of 0.455MPa.
Table 3. The table gives the HDT of PLA, PHBV and the Blends on placing a load of 0.455 Mpa.
sample (wt/wt/wt)
|
T (°C)
| |
neat PLA
|
55.2
|
± 0.2
|
neat PHBV
|
115
|
± 0.5
|
PLA/PHBV/PBS(60/30/10)
|
58.9
|
± 0.3
|
PLA/PHBV/PBS (60/10/30)
|
58.4
|
± 0.1
|
PHBV/PLA/PBS (60/30/10)
|
72.2
|
± 0.1
|
PHBV/PLA/PBS(60/10/30)
|
87.5
|
± 0.3
|
These values has been compared with the studies of Kawamoto et al. who devised that the HDT of an amorphous polymer will be near to its glass transition temperature and that of a polymer with high crystalline structure will be near to its melting point. Near PHBV has HDT of 115 and PLA has a HDT of 55.2 °C which is justified. Blends which had PLA as the base, the HDT can be noticed to have increased from 55 to 58°C when adding the other two polymer components. There is a slight increase in the temperature and this can be due to the crystallization of PLA. With the increase in PHBV concentration, the HDT also was noticed to have increased significantly.
3.8 Melt Flow Index
The MFI is an important measure to understand how well the polymer can be processed in the melt form. The result of the experiment to determine the Melt Flow Index is represented in the table for the Pure polymers and the Blends.
Table 4. MFI
sample (wt/wt/wt)
|
MFI (190 °C) g/10 min
| |
neat PLA
|
32
|
± 1.3
|
neat PHBV
|
13.9
|
± 2.0
|
neat PBS
|
30.1
|
± 1.5
|
PLA/PHBV/PBS(60/30/10)
|
34.5
|
± 2.5
|
PLA/PHBV/PBS (60/10/30)
|
35.1
|
± 3.2
|
PHBV/PLA/PBS (60/30/10)
|
28.5
|
± 2.1
|
PHBV/PLA/PBS(60/10/30)
|
29.1
|
± 1.3
|
The MFI value for PBS and PLA can be noticed to be the same as 30g/10 min where PHBV has a value of 13.9g/10 min. This shows that it has high viscosity value. Moving over to the blend values, blend with PLA as matrix has only slight different which can be put down to be caused due to the processing procedures which increases the molecular weight and thermal properties. But, blends with PHBV as matrix had a sharp increase in the value and was almost double that in its neat form. This shows that the blends thus formed have a better flowing property which makes it useful for the production of fiber-reinforced composites.
Conclusion
The first report was on the production of an innovative fully biodegradable ternary blend which comprised of PLA/PHBV/PBS blend which could create high performance material. The blend thus created displayed unique and superior mechanical characteristics which was much above the homogeneous polymer or binary blends created. When PHBV and PBS was dispersed as minor phases into the PLA matrix, it increased the characteristics of flexibility and strength of the blend and also reduced the elastic coefficient of PLA to the optimal level as required. When PHBV was used as the matrix in the PHBV/PLA/PBS blend, the polymer displayed better stiffness and strength. With neat PLA, it produced brittle fracture of the impact-fracture surface in SEM micrograph and this failure was changed to ductile fracture in the blend form. According to DMA studies, PHBV and PLA were lightly miscible with each other while both of they were not compatible with PBS. PHBV when added to PBS and PLA improved its crystallization property, but at the same time, PBS and PLA prevented the crystallization of PHBV in the blend system. In SEM analysis, separated phases for observed for all blend compositions except for PHBV/PLA/PBS composition of 60/30/10 where it was found to have a core-shell structure. PLA in its neat form had a lower thermal resistance and it was increased with the addition of PBS and PHBV. PHBV was a good matrix with good thermal resistance when compared to PLA. On an overall, based on the HDT studies and other mechanical properties, the blend PHBV/PLA/PBS blend in 60/30/10 was found to be the best performing blend in terms of stiffness, toughness and thermal resistance.
No comments:
Post a Comment